India's export story over the past few years has looked deceptively flat on the surface, even as the economy around it has been shifting gears: manufacturing is gaining ground, global supply chains are reorganizing, and traditional strengths like petroleum are losing share. The real picture emerges once you look past the headline number and into what's actually being sold, to whom, and how that mix has changed.
Key Points/Summary:
- India’s merchandise exports have stayed near USD 440 billion for three years, but the flat total hides a major shift in what the country sells.
- Imports rose by USD 59.7 billion while exports fell by USD 9.6 billion, so India now earns about 57 cents for every dollar it spends abroad, down from 63.
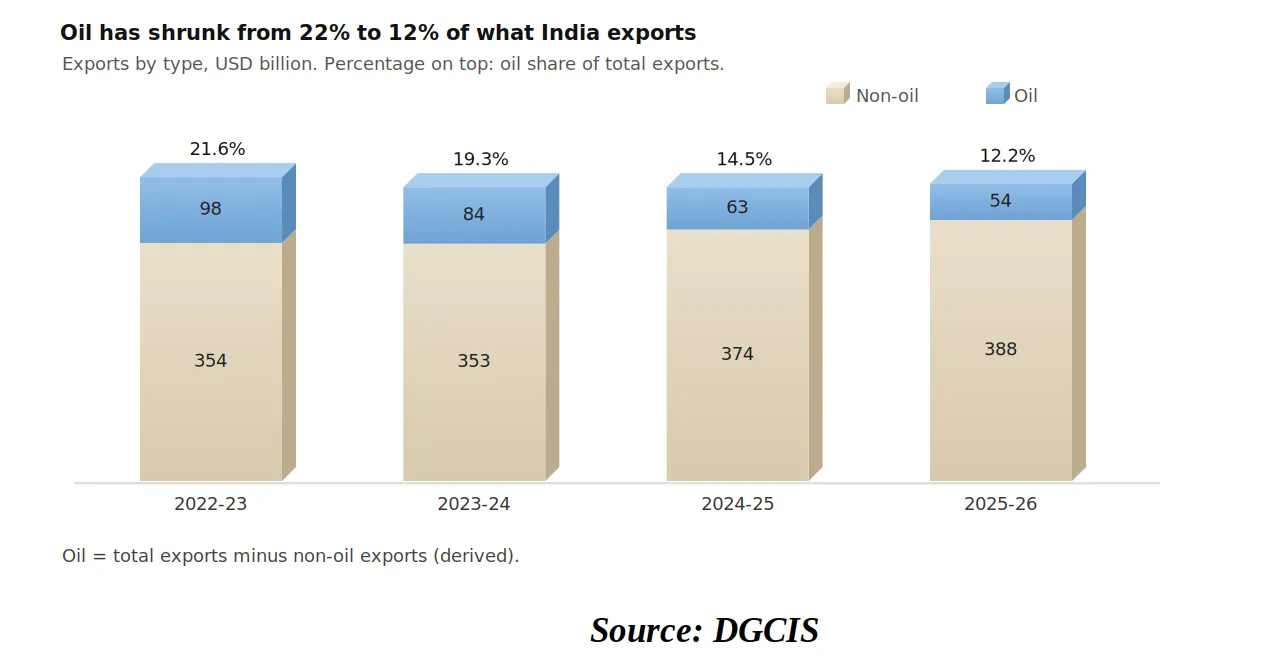
- Petroleum fell from 22% to 12% of exports, while non-oil exports grew every year since 2023-24, led by electronics, medicines and vehicles.
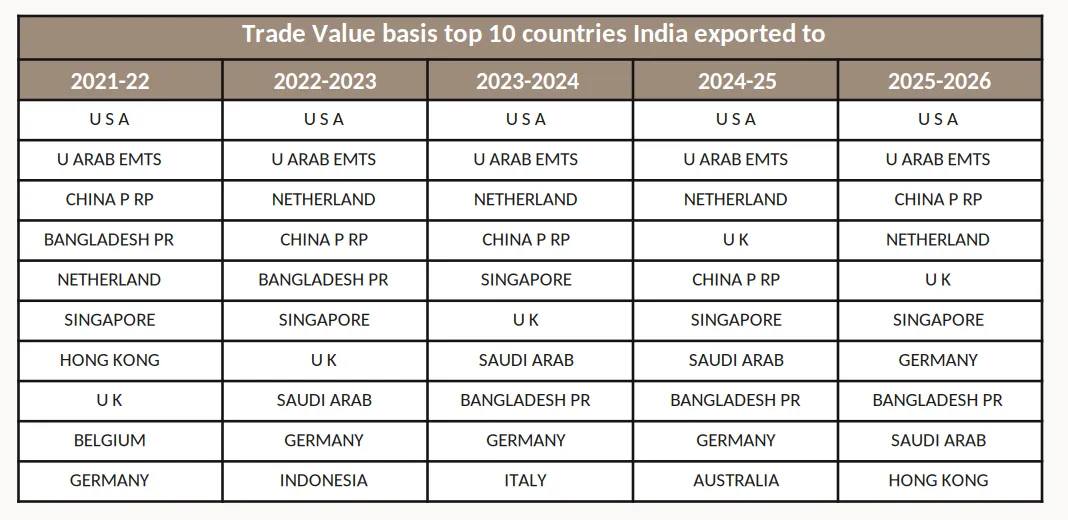
- The US and UAE remain India’s top two buyers, while Europe is gaining ground and Bangladesh is losing it.
The improvement is real but narrow, and non-oil imports (partly driven by gold prices) are growing about three times faster than non-oil exports.
A flat line with a story behind it
The headline hides two opposing trends. Petroleum exports, which have long been a major part of India's exports, have fallen sharply, pulling down overall export growth. At the same time, non-oil exports, especially electronics, medicines and vehicles, have grown every year since 2023-24. These two trends have largely cancelled each other out, leaving total exports almost unchanged.
Imports, meanwhile, have continued to rise. This has widened India's trade deficit even as its export basket becomes more diverse. In simple terms, India is exporting a wider range of products, but its import bill is growing faster than its export earnings.
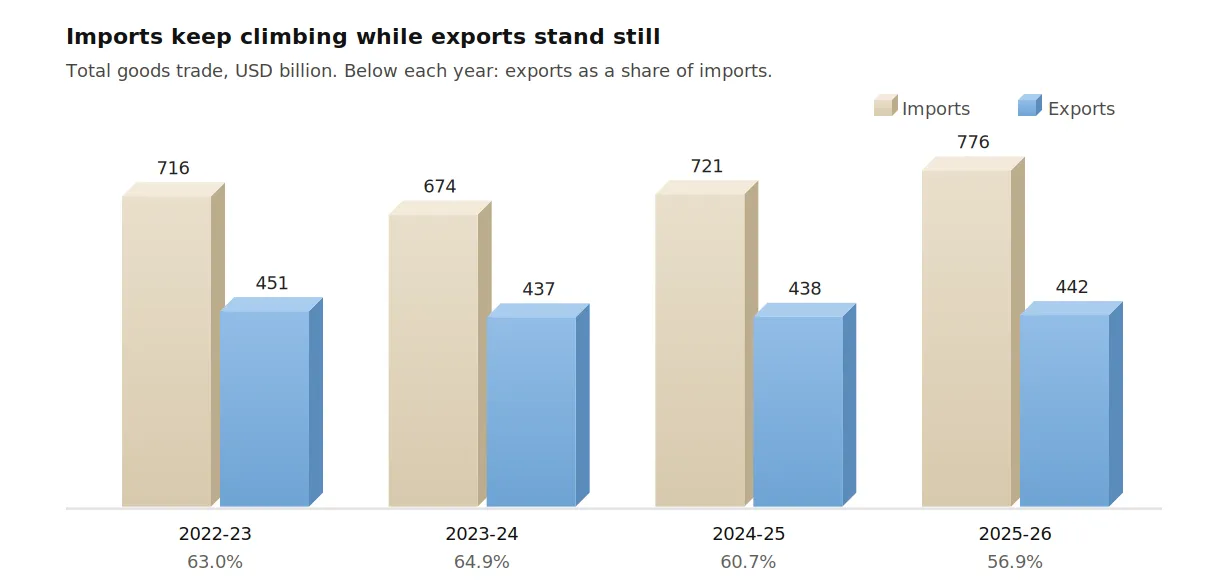
In 2023-24, both imports and exports dipped as the post-pandemic surge faded. From there, their paths diverged. Imports recovered and grew by about 7% in each of the following two years, adding USD 59.7 billion over three years. Exports edged up by less than 1% a year and still sit USD 9.6 billion below their 2022-23 level.
Also, the export cover ratio (exports as a share of imports) slipped from 63.0% to 56.9%. For every dollar India spent abroad in 2025-26, it earned back roughly 57 cents, against 63 cents three years earlier.
If you look beyond headline numbers, India’s export basket is gradually shifting away from petroleum towards other products.
Petroleum exports fell every year, from USD 97.5 billion to USD 53.8 billion: a decline of 45%, or roughly 18% a year. Over the same period, non-oil exports rose about 10%, from USD 353.6 billion to USD 387.6 billion.
The effect on the composition of India's exports is worth acknowledging. Petroleum made up more than a fifth of the basket in 2022-23 and about an eighth by 2025-26. The flat headline, in other words, does not reflect an absence of growth. It reflects oil's decline offsetting real growth everywhere else.
But where does the imbalance really comes from?
Excluding oil, the export side looks considerably healthier: non-oil exports grew 6.1% in 2024-25 and 3.6% in 2025-26, well ahead of the near-zero growth in the total. The import side moves the other way. Non-oil imports grew 8.1% and then 12.4%, faster than total imports, so the gap widens even when oil is removed.
Gold accounts for much of this. Its import value rose 36% in 2024-25 and 24% in 2025-26, yet the quantity imported rose only about 1% in the first year and fell in the second. That points to higher gold prices rather than a broad surge in domestic demand. Two stories therefore sit inside one headline: genuine momentum in exports, and an import bill inflated in part by the price of a single metal.
Who buys from India and what does India sells?
The United States and the UAE have ranked first and second among India's export markets in every year from 2021-22 to 2025-26.
The clearest movement is westward. By 2025-26, three European markets, the Netherlands, the United Kingdom and Germany, sat among India's top seven, each having improved its rank over the period. Bangladesh, a neighbouring and textile-linked market, moved the other way, slipping from fourth to eighth. China's brief dip to fifth place proved temporary, with electronics driving its return to third.
Stability at the top is a strength in execution but also a structural risk: US and UAE anchor the map so firmly that the rest of the table is effectively competition for third place.
If you look at the commodity mix sold by India, petroleum is still the single biggest export even after its value nearly halved.
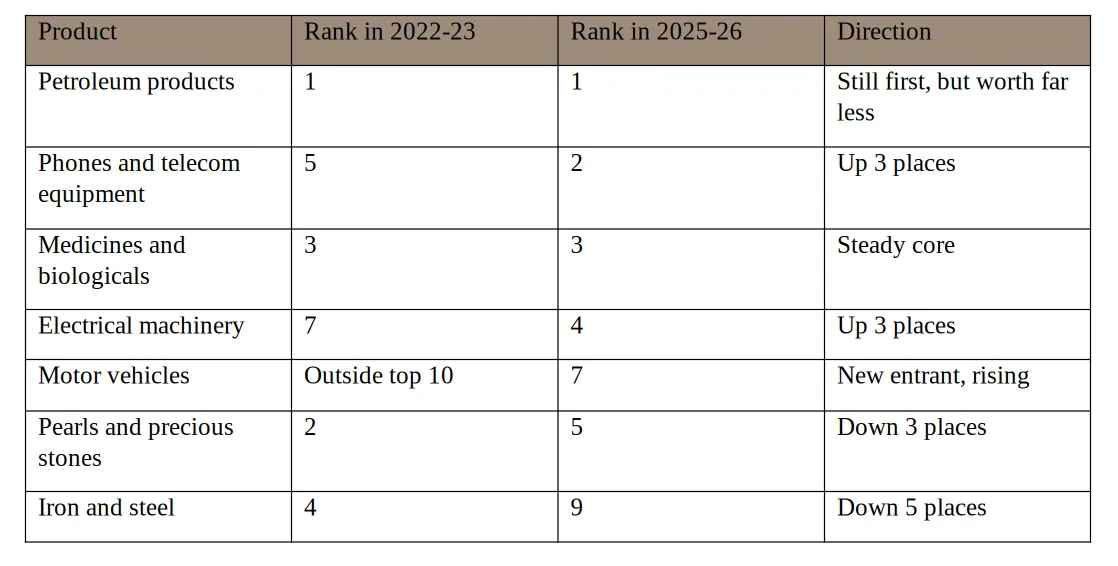
If you look at the commodity mix sold by India, petroleum is still the single biggest export even after its value nearly halved.
India’s export basket is gradually shifting towards electronics and other manufactured goods, while traditional exports such as gemstones are losing ground. Petroleum remains the largest export category, despite a sharp fall in its value from USD 97.5 billion to USD 53.8 billion, showing how much larger it is than other individual categories. Meanwhile, vehicles have gained importance, and ships and boats have entered the top 10 in the latest data. Overall, these changes point to a gradual shift towards manufactured goods, although petroleum continues to dominate India's exports.
The bottom line
India's exports are not stagnating; they are being rebuilt. The country is moving out of oil and precious stones, and into electronics, medicines and vehicles, selling less to its South Asian neighbours and more to Europe and the US.
Two cautions apply. The gain is narrow: electronics carries much of it, and the US buys much of the electronics. And it is outpaced: non-oil imports are growing roughly three times faster than non-oil exports, so a better export mix is still producing a wider trade gap.
